PhD Research and Development
ABSTRACT
This is a study into the potential of network effects of innovations in the mobile telecommunication industry. The study investigates case examples and simulates the diffusion of mobile communication services by system dynamic models to answer the question
“What network effect potential do mobile communication services have and how can the network effect potential be leveraged?”
Finally the study is tested by Roger’s model of the critical mass point. This test leads to a different result for mobile telecommunication services which could have significant practical implications.
In the most European countries the market of mobile phones is saturated and the penetration exceeds 100%. Regardless of the huge expenses in marketing measures, quality customer services and customer loyalty the mobile churn rate in the most European countries is between 12% (Switzerland), 20% (Germany) and 30% (UK) per year (Group1 Software Study 2009). The amount of subscribers and the average revenue per user (ARPU) to a mobile network operator is crucial for the turnover potential and success. The extensive competition and new technologies e.g. VoIP exerts pressure on ARPU rates. The mobile ARPU drops between 5% and 15% year-over-year. Increasing or even stabilise the ARPU and the number of subscriber in a sustainable way only made by marketing expenses is apparently not successful. Innovations are a key driver of growth (Tucker, R.B. (2002). New innovative products and services in the mobile telecommunication industry are effective for attracting new costumer and creating additional average revenue per user e.g. Short Message Service (SMS); Apple’s iPhone and iPad. Especially in the mobile communication the success of an innovation can be strengthened by leveraging network effects. The velocity of propagation of an innovation is directly proportional to the increase in the sales curve. The drivers of exponential growth are therefore the most significant factors of success given the conditions of the mobile operator markets. MNO’s often don’t know the exact reason why an innovation with the potential of network effects takes off with considerable success whereas other innovations make no headway. Therefore it would be instrumental to identify those indicators, which have a decisive influence especially on the velocity of propagation of innovations and thus on the diffusion process considering network effects. These most effective indicators are defined in this thesis as key indicators. The network effect potential and therefore the success of an innovation can be leveraged by affecting the key indicators in a positive way. The analysis based on system dynamics models (SD-models) approach shows a surprising result. Marginal changes of the key indicators have a decisive influence on the diffusions process. The knowledge of this result makes a contribution that is value to managers, investors and analysts in the mobile telecommunication industry.
The methodology consists of four distinct parts which all develop on the preceding part. Thirst part is the extensive literature research and holding of expert interviews to indentify the standard indicators and those who have an influence on the velocity of propagation of an innovation. When most of the experts confirmed the results of the literature research especially mobile telecommunication made interesting statements such as the community will steer the success of an innovation. This is an important statement that is later confirmed in this work. Now we have identified the standard indicators but we don’t know the amplitude of the indicators i.e. what is the range between the minimum and the maximum within the scale that an individual standard indicator will assume.
The second part consists of an empirical survey with students and professors of four European universities to analyse the mobile user behaviour patterns and the amplitude range of the indicators within common mobile telecommunication services. This sample consists of youthful and frequently cellular phone users which are using preferable the full range of mobile telecommunication services. Consequently the user habits can be easy compared and the amplitude range of the indicators can be analysed. By means of the limited time the database administrator of the universities supported the author by the distribution of the questionnaires. Thereby 8’000 questionnaires were sent out within a relatively short time. The outcome of the analysis of the questionnaires in part two shows the amplitude range of the individual indicators and their interdependencies. The analysis of interdependencies (reciprocal relation between interdependent indicators) is important to define the mathematical equations for the diffusion model.
The third part consists of an SD-model based analysis of the previous analysed indicators and will identify the important key indicators and their decisive influence on the potential of network effects. A key indicator is defined as one which has a crucial positive or negative influence on the diffusion process. The diffusion process is derived through system dynamics model. By analysing the different runs of the SD-models the two key indicators for network effects (NE) were identified as the Relevant Adopter Fraction (RAF, i.e. the size of the personal communication network) and the Price-Performance Ratio (PPR). On this basis of these two key indicators together with additional indicators like e.g. Average Utility, Desired Utility, Installed Base, Innovators, Early Adopters, Contact Rate, Risk and Discontinuation, a unique diffusion process profile of each investigated innovation is developed. Those profiles can be compared to each other to analyse the network effect potential of mobile telecommunication services.
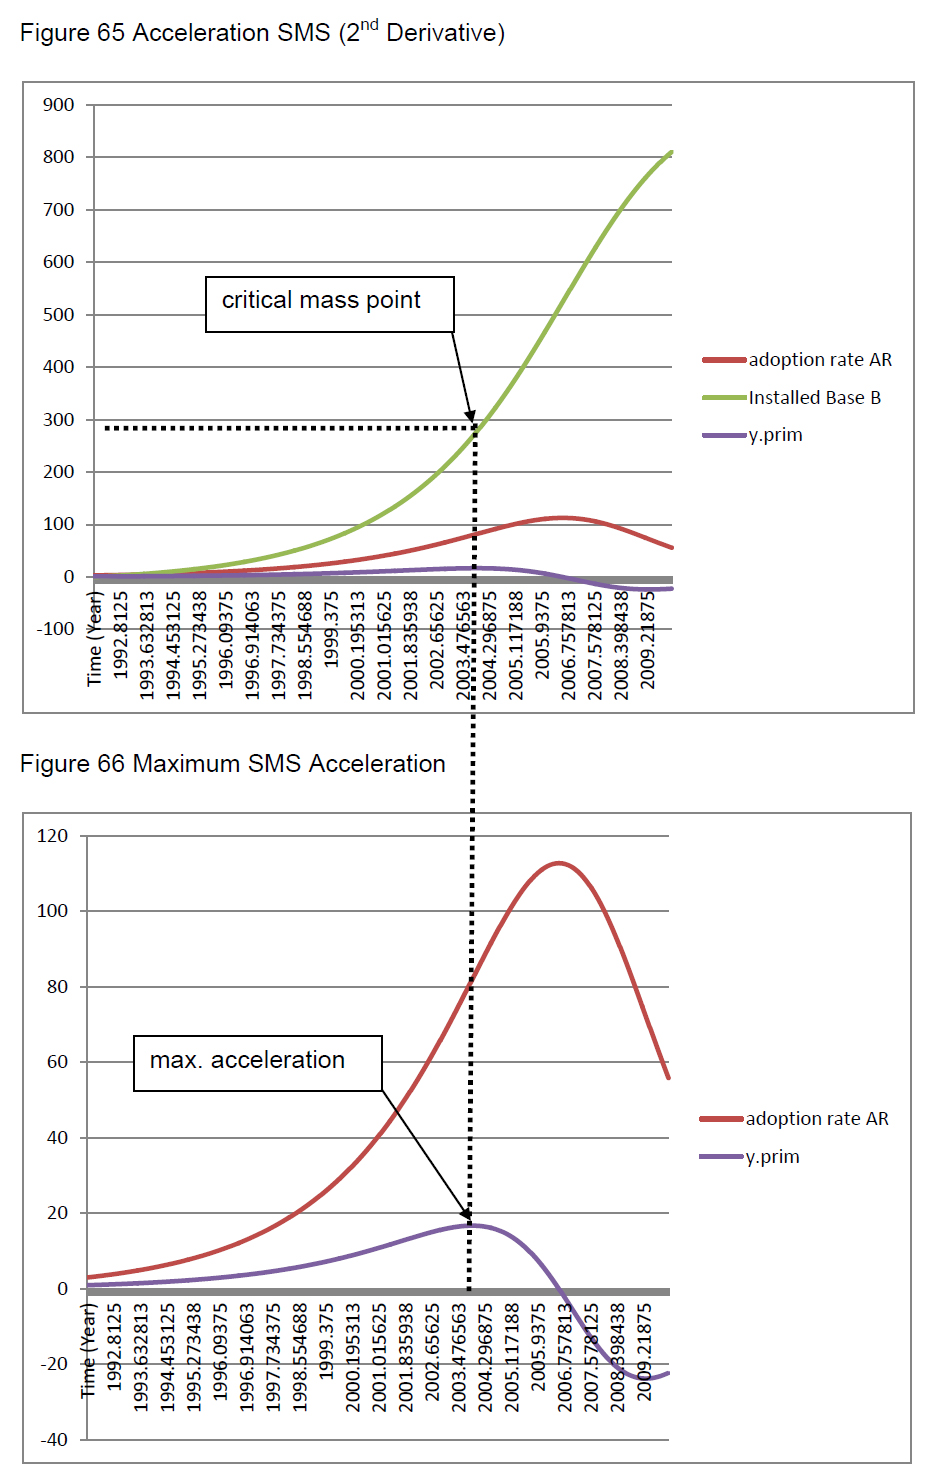
The fourth part consists of a test of the results of this thesis with Roger’s model of the critical mass point. The critical mass point is the point in which there are enough adopters of an innovation in the diffusion curve so that the growth of the new mobile technology becomes self-sustaining. Rogers, 1983 and Valente, 1995, expected that the critical mass point occurs between 10 and 20% adoption. This investigation leads to a different result for mobile telecommunication services as the calibrated SD-models show that the critical mass point between 25 and 27% adoption for Mobile Voice and SMS. The difference between Roger’s results and these findings on the time scale is between two and four years and this could have significant practical implications as mobile services should not be stopped prematurely on account of a wrong expectation.
It is crucial for the market success of innovations to achieve the critical mass point as quick as possible. The developed SD-model enables analyses into network effect potential of mobile telecommunication services and will be capable to optimise leverage effects. Further the SD-model determines the time between market entry and critical mass point in dependence of the network potential. This again reduces the risks of a prematurely abort of the market introduction and enables a more precise planning of financial and human resources.
This is a study into the potential of network effects of innovations in the mobile telecommunication industry. The study investigates case examples and simulates the diffusion of mobile communication services by system dynamic models to answer the question
“What network effect potential do mobile communication services have and how can the network effect potential be leveraged?”
Finally the study is tested by Roger’s model of the critical mass point. This test leads to a different result for mobile telecommunication services which could have significant practical implications.
In the most European countries the market of mobile phones is saturated and the penetration exceeds 100%. Regardless of the huge expenses in marketing measures, quality customer services and customer loyalty the mobile churn rate in the most European countries is between 12% (Switzerland), 20% (Germany) and 30% (UK) per year (Group1 Software Study 2009). The amount of subscribers and the average revenue per user (ARPU) to a mobile network operator is crucial for the turnover potential and success. The extensive competition and new technologies e.g. VoIP exerts pressure on ARPU rates. The mobile ARPU drops between 5% and 15% year-over-year. Increasing or even stabilise the ARPU and the number of subscriber in a sustainable way only made by marketing expenses is apparently not successful. Innovations are a key driver of growth (Tucker, R.B. (2002). New innovative products and services in the mobile telecommunication industry are effective for attracting new costumer and creating additional average revenue per user e.g. Short Message Service (SMS); Apple’s iPhone and iPad. Especially in the mobile communication the success of an innovation can be strengthened by leveraging network effects. The velocity of propagation of an innovation is directly proportional to the increase in the sales curve. The drivers of exponential growth are therefore the most significant factors of success given the conditions of the mobile operator markets. MNO’s often don’t know the exact reason why an innovation with the potential of network effects takes off with considerable success whereas other innovations make no headway. Therefore it would be instrumental to identify those indicators, which have a decisive influence especially on the velocity of propagation of innovations and thus on the diffusion process considering network effects. These most effective indicators are defined in this thesis as key indicators. The network effect potential and therefore the success of an innovation can be leveraged by affecting the key indicators in a positive way. The analysis based on system dynamics models (SD-models) approach shows a surprising result. Marginal changes of the key indicators have a decisive influence on the diffusions process. The knowledge of this result makes a contribution that is value to managers, investors and analysts in the mobile telecommunication industry.
The methodology consists of four distinct parts which all develop on the preceding part. Thirst part is the extensive literature research and holding of expert interviews to indentify the standard indicators and those who have an influence on the velocity of propagation of an innovation. When most of the experts confirmed the results of the literature research especially mobile telecommunication made interesting statements such as the community will steer the success of an innovation. This is an important statement that is later confirmed in this work. Now we have identified the standard indicators but we don’t know the amplitude of the indicators i.e. what is the range between the minimum and the maximum within the scale that an individual standard indicator will assume.
The second part consists of an empirical survey with students and professors of four European universities to analyse the mobile user behaviour patterns and the amplitude range of the indicators within common mobile telecommunication services. This sample consists of youthful and frequently cellular phone users which are using preferable the full range of mobile telecommunication services. Consequently the user habits can be easy compared and the amplitude range of the indicators can be analysed. By means of the limited time the database administrator of the universities supported the author by the distribution of the questionnaires. Thereby 8’000 questionnaires were sent out within a relatively short time. The outcome of the analysis of the questionnaires in part two shows the amplitude range of the individual indicators and their interdependencies. The analysis of interdependencies (reciprocal relation between interdependent indicators) is important to define the mathematical equations for the diffusion model.
The third part consists of an SD-model based analysis of the previous analysed indicators and will identify the important key indicators and their decisive influence on the potential of network effects. A key indicator is defined as one which has a crucial positive or negative influence on the diffusion process. The diffusion process is derived through system dynamics model. By analysing the different runs of the SD-models the two key indicators for network effects (NE) were identified as the Relevant Adopter Fraction (RAF, i.e. the size of the personal communication network) and the Price-Performance Ratio (PPR). On this basis of these two key indicators together with additional indicators like e.g. Average Utility, Desired Utility, Installed Base, Innovators, Early Adopters, Contact Rate, Risk and Discontinuation, a unique diffusion process profile of each investigated innovation is developed. Those profiles can be compared to each other to analyse the network effect potential of mobile telecommunication services.
The fourth part consists of a test of the results of this thesis with Roger’s model of the critical mass point. The critical mass point is the point in which there are enough adopters of an innovation in the diffusion curve so that the growth of the new mobile technology becomes self-sustaining. Rogers, 1983 and Valente, 1995, expected that the critical mass point occurs between 10 and 20% adoption. This investigation leads to a different result for mobile telecommunication services as the calibrated SD-models show that the critical mass point between 25 and 27% adoption for Mobile Voice and SMS. The difference between Roger’s results and these findings on the time scale is between two and four years and this could have significant practical implications as mobile services should not be stopped prematurely on account of a wrong expectation.
It is crucial for the market success of innovations to achieve the critical mass point as quick as possible. The developed SD-model enables analyses into network effect potential of mobile telecommunication services and will be capable to optimise leverage effects. Further the SD-model determines the time between market entry and critical mass point in dependence of the network potential. This again reduces the risks of a prematurely abort of the market introduction and enables a more precise planning of financial and human resources.